In every application, graphics play a major role in making it more user-friendly. Graphics make concepts easier to understand. In this chapter, we will be covering the following topics:
- Displaying mouse coordinates
- Displaying coordinates where the mouse button is clicked and released
- Displaying a point where the mouse button is clicked
- Drawing a line between two mouse clicks
- Drawing lines of different types
- Drawing a circle of a desired size
- Drawing a rectangle between two mouse clicks
- Drawing text in a desired font and size
- Creating a toolbar that shows different graphics tools
 Plotting a line using Matplotlib
  Plotting a bar using Matplotlib
Introduction
For drawing and painting in Python, we will be making use of several classes. The most important of them is the QPainter class.
This class is used for painting. It can draw lines, rectangles, circles, and complex shapes. While drawing with QPainter, you can use the QPainter class pen to define the color of the drawing; thickness of the pen/brush; style; whether the line is drawn as solid, dotted, or dash-dot; and so on.
Several methods of the QPainter class are used in this chapter to draw different shapes. A few of them are listed here:
- QPainter::drawLine(): This method is used for drawing a line between two sets of x and y coordinates
- QPainter::drawPoints(): This method is used for drawing a point at a location specified through the supplied x and y coordinates
- QPainter::drawRect(): This method is used for drawing a rectangle between two sets of x and y coordinates
- QPainter::drawArc(): This method is used for drawing an arc from the specified center location, between two specified angles, and with a specified radius
- QPainter::drawText(): This method is used for drawing text in a specified font style, color, and size
To understand the different classes and methods required to display graphics practically, let's follow some recipes.
Displaying mouse coordinates
To draw any shape with the mouse, you need to know where the mouse button is clicked, to where the mouse is dragged, and where the mouse button is released. Only after knowing the coordinates where the mouse button is clicked can you go ahead and execute commands to draw different shapes. In this recipe, we will be learning to display the x and y coordinates to which the mouse is moved on the form.
How to do it...
In this recipe, we will be tracking mouse movement and will be displaying the x and y coordinates which the mouse is moved on the form. So, in all, we will be using two Label widgets in this application, one for displaying a message and the other for displaying mouse coordinates. The complete steps for creating this application are shown here:
- Let's create an application based on the Dialog without Buttons template.
- Add two QLabel widgets to the form by dragging and dropping two Label widgets on the form.
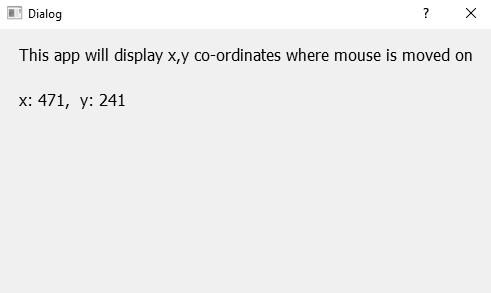
- Set the text property of the first Label widget to This app will display x,y coordinates where mouse is moved on.
- Delete the text property of the second Label widget as its text property will be set through code.
- Save the application by name as demoMousetrack.ui.
The form will now appear as shown in the following screenshot:
The user interface created with Qt Designer is stored in a .ui file, which is an XML file, and needs to be converted into Python code. The pyuic5 utility is used for converting the XML file into Python code. The generated Python script, demoMousetrack.py, can be seen in the source code bundle of the book.
- Treat the demoMousetrack.py script as a header file, and import it into the file from which you will invoke its user interface design.
- Create another Python file with the name callMouseTrack.pyw and import the demoMousetrack.py code into it:
import sys
from PyQt5.QtWidgets import QDialog, QApplication
from demoMousetrack import *
class MyForm(QDialog):
    def __init__(self):
        super().__init__()
        self.ui = Ui_Dialog()
        self.setMouseTracking(True)
        self.ui.setupUi(self)
        self.show()
    def mouseMoveEvent(self, event):
        x = event.x()
        y = event.y()
        text = "x: {0}, y: {1}".format(x, y)
        self.ui.label.setText(text)
if __name__=="__main__":
    app = QApplication(sys.argv)
    w = MyForm()
    w.show()
    sys.exit(app.exec_())
How it works...
To enable the application to keep track of the mouse, a method,
setMouseTracking(True), is used. This method will sense the mouse movement and whenever the mouse is moved, it will invoke the mouseMoveEvent() method. In mouseMoveEvent(), the x and y methods are invoked on the event object to get the x and y coordinate values of the mouse's location. The x and y coordinates are assigned to the x and y variables respectively. The values in the x and y coordinates are displayed in the desired format via the Label widget.
On running the application, you will get a message that on moving the mouse, its x and y coordinate values will be displayed. When you move the mouse on the form, the x and y coordinates of the mouse location will be displayed through the second Label widget, as shown in the following screenshot:
Displaying coordinates where the mouse button is clicked and released
In this recipe, we will be learning to display the x and y coordinates where the mouse button is clicked, along with the coordinates of where the mouse button is released.
How to do it...
Two methods, mousePressEvent() and mouseReleaseEvent(), will play major role in this recipe. The mousePressEvent() method will be automatically invoked when the mouse is pressed and will reveal the x and y coordinates when the mouse press event has occurred. Similarly, the mouseReleaseEvent() method will be invoked automatically whenever the mouse button is released. Two Label widgets will be used in this recipe to display the coordinates where the mouse button is clicked and where the mouse button is released. Here are the steps to create such an application:
- Let's create an application based on the Dialog without Buttons template.
- Add three QLabel widgets to the form by dragging and dropping three Label widgets on the form.
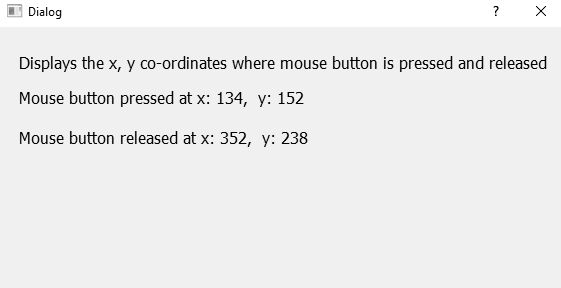
- Set the text property of the first Label widget to Displays the x,y coordinates where mouse is pressed and released.
- Delete the text property of the second and third Label widgets, as their text properties will be set through code.
- Set the objectName property of the second Label widget to labelPress, as it will be used for displaying the x and y coordinates of the location where the mouse button is clicked.
- Set the objectName property of the third Label widget to labelRelease because it will be used for displaying the x and y coordinates of the location where the mouse button is released.
- Save the application by name as demoMouseClicks.ui.
The form will now appear as shown in the following screenshot:
The user interface created with Qt Designer is stored in a .ui file, which is an XML file, and needs to be converted into Python code. The pyuic5 utility is used for converting the XML file into Python code. The generated Python script, demoMouseClicks.py, can be seen in the source code bundle of the book.
- Treat the demoMouseClicks.py script as a header file, and import it into the file from which you will invoke its user interface design.
- Create another Python file with the name callMouseClickCoordinates.pyw and import the demoMouseClicks.py code into it:
import sys
from PyQt5.QtWidgets import QDialog, QApplication
from demoMouseClicks import *

class MyForm(QDialog):
    def __init__(self):
        super().__init__()
        self.ui = Ui_Dialog()
        self.ui.setupUi(self)
        self.show()
    def mousePressEvent(self, event):
        if event.buttons() & QtCore.Qt.LeftButton:
            x = event.x()
            y = event.y()
            text = "x: {0}, y: {1}".format(x, y)
            self.ui.labelPress.setText('Mouse button pressed at' + text)
    def mouseReleaseEvent(self, event):
        x = event.x()
        y = event.y()
        text = "x: {0}, y: {1}".format(x, y)
        self.ui.labelRelease.setText('Mouse button released at' + text)
        self.update()
if __name__=="__main__":
    app = QApplication(sys.argv)
    w = MyForm()
    w.show()
    sys.exit(app.exec_())
How it works...
Two methods are automatically invoked when you click the mouse. The mousePressEvent() method is invoked when you press the mouse button and the mouseReleaseEvent() method is invoked when you release the mouse button. To display the x and y coordinates of the location where the mouse button is clicked and released, we make use of these two methods. In both the methods, we simply invoke the x() and y() methods on the event object to fetch the x and y coordinate values of the mouse location. The fetched x and y values will be assigned to the x and y variables, respectively. The values in the x and y variables are formatted in the desired format and displayed through the two Label widgets.
On running the application, you will get a message that the x and y coordinates of the location where the mouse button is clicked and released will be displayed.
When you press the mouse button and release it, the x and y coordinates of the location where the mouse is pressed and released will be displayed through the two Label widgets, as shown in the following screenshot:
Displaying a point where the mouse button is clicked
In this recipe, we will be learning to display the point where the mouse button is clicked on the form. Point here means a dot. That is, wherever the user presses the mouse, a dot will appear at that coordinate. You will also learn to define the size of the dot too.
How to do it...
The mousePressEvent() method will be used in this recipe as it is the method that is automatically invoked when the mouse is pressed on the form. In the mousePressEvent() method, we will execute the command to display a dot or point of the desired size. Here are the steps to understand how you can display a point or dot on the form where the mouse button is clicked:
- Let's create an application based on the Dialog without Buttons template.
- Add a QLabel widgets to the form by dragging and dropping a Label widget on the form.
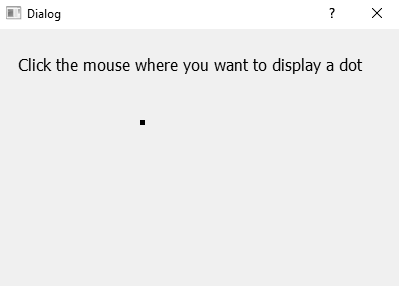
- Set the text property of the Label widget to Click the mouse where you want to display a dot.
- Save the application by name as demoDrawDot.ui.
The form will now appear as shown in the following screenshot:
The user interface created with Qt Designer is stored in a .ui file, which is an XML file, and needs to be converted into Python code. The pyuic5 utility is used for converting the XML file into Python code. The generated Python script, demoDrawDot.py, can be seen in the source code bundle of the book.
- Treat the demoDrawDot.py script as a header file, and import it into the file from which you will invoke its user interface design.
- Create another Python file with the name callDrawDot.pyw and import the demoDrawDot.py code into it:
import sys
from PyQt5.QtWidgets import QDialog, QApplication
from PyQt5.QtGui import QPainter, QPen
from PyQt5.QtCore import Qt
from demoDrawDot import *
class MyForm(QDialog):
    def __init__(self):
        super().__init__()
        self.ui = Ui_Dialog()
        self.ui.setupUi(self)
        self.pos1 = [0,0]
        self.show()
    def paintEvent(self, event):
        qp = QPainter()
        qp.begin(self)
        pen = QPen(Qt.black, 5)
        qp.setPen(pen)
        qp.drawPoint(self.pos1[0], self.pos1[1])
        qp.end()
    def mousePressEvent(self, event):
        if event.buttons() & QtCore.Qt.LeftButton:
            self.pos1[0], self.pos1[1] = event.pos().x(), event.pos().y()
            self.update()
if __name__=="__main__":
    app = QApplication(sys.argv)
    w = MyForm()
    w.show()
    sys.exit(app.exec_())
How it works...
Because we want to display the point where the mouse button is clicked, the mousePressEvent() method is used. In the mousePressEvent() method, the pos().x() and pos().y() methods are invoked on the event object to fetch the locations of the x and y coordinates and assign them to the 0 and 1 elements of the pos1 array. That is, the pos1 array is initialized to the x and y coordinate values where the mouse button is clicked. After initializing the pos1 array, the self.update() method is called to invoke the paintEvent() method.
In the paintEvent() method, an object of the QPainter class is defined by name as qp. An object of the QPen class is defined by name as pen to set the thickness of the pen and its color. Finally, a point is displayed by invoking the drawPoint() method at the location whose value is defined in the pos1 array, that is, where the mouse button is clicked.
On running the application, you will get a message that a dot will be displayed where the mouse button will be clicked. When you click the mouse, a point will appear at that location, as shown in the following screenshot:
Drawing a line between two mouse clicks
In this recipe, we will learn to display a line between two points, from where the mouse button is clicked till where the mouse button is released on the form. The focus of this recipe is to understand how the mouse press and release events are handled, how the x a and y coordinates where the mouse button is clicked and released are accessed, and how a line is drawn from the location where the mouse button is clicked to the location where the mouse button is released.
How to do it...
The major players in this recipe are the mousePressEvent(), mouseReleaseEvent(), and paintEvent() methods. The mousePressEvent() and mouseReleaseEvent() methods are automatically executed whenever the mouse button is clicked or released, respectively. These two methods will be used to access the x and y coordinates where the mouse button is clicked and released. Finally, the paintEvent() method is used to draw a line between the coordinates that were supplied by the mousePressEvent() and mouseReleaseEvent() methods. Here is the step-by-step procedure to create this application:
- Let's create an application based on the Dialog without Buttons template.
- Add a QLabel widget to the form by dragging and dropping a Label widget on the form.
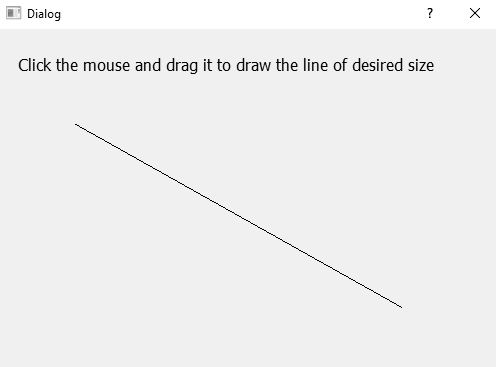
- Set the text property of the Label widget to Click the mouse and drag it to draw the line of desired size.
- Save the application by name as demoDrawLine.ui.
The form will now appear as shown in the following screenshot:
The user interface created with Qt Designer is stored in a .ui file, which is an XML file, and needs to be converted into Python code. The pyuic5 utility is used for converting the XML file into Python code. The generated Python script, demoDrawLine.py, can be seen in the source code bundle of the book.
- Treat the demoDrawLine.py script as a header file, and import it into the file from which you will invoke its user interface design.
- Create another Python file with the name callDrawLine.pyw and import the demoDrawLine.py code into it:
import sys
from PyQt5.QtWidgets import QDialog, QApplication
from PyQt5.QtGui import QPainter
from demoDrawLine import *
class MyForm(QDialog):
    def __init__(self):
        super().__init__()
        self.ui = Ui_Dialog()
        self.ui.setupUi(self)
        self.pos1 = [0,0]
        self.pos2 = [0,0]
        self.show()
    def paintEvent(self, event):
        qp = QPainter()
        qp.begin(self)
        qp.drawLine(self.pos1[0], self.pos1[1], self.pos2[0],self.pos2[1])
        qp.end()
    def mousePressEvent(self, event):
        if event.buttons() & QtCore.Qt.LeftButton:
            self.pos1[0], self.pos1[1] = event.pos().x(),event.pos().y()
    def mouseReleaseEvent(self, event):
        self.pos2[0], self.pos2[1] = event.pos().x(),event.pos().y()
        self.update()
if __name__=="__main__":
    app = QApplication(sys.argv)
    w = MyForm()
    w.show()
    sys.exit(app.exec_())
How it works...
As we want to display a line between the locations where the mouse button is clicked and released, we will be making use of two methods, mousePressEvent() and mouseReleaseEvent(). As the name suggests, the mousePressEvent() method is automatically invoked when a mouse button is pressed. Similarly, the mouseReleaseEvent() method is automatically invoked when the mouse button is released. In these two methods, we will be simply saving the values of the x and y coordinates where the mouse button is clicked and released. Two arrays are defined in this application, pos1 and pos2, where pos1 stores the x and y coordinates of the location where the mouse button is clicked, and the pos2 array stores the x and y coordinates of the location where the mouse button is released. Once the x and y coordinates of the locations where the mouse button is clicked and released are assigned to the pos1 and pos2 arrays, the self.update() method is invoked in the mouseReleaseEvent() method to invoke the paintEvent() method. In the paintEvent() method, the drawLine() method is invoked and the x and y coordinates stored in the pos1 and pos2 array are passed to it to draw a line between the mouse press and mouse release locations.
On running the application, you will get a message to click and drag the mouse button between the locations where the line is required. So, click the mouse button and keeping the mouse button pressed, drag it to the desired location and release the mouse button. A line will be drawn between the locations where the mouse button is clicked and where it is released, as shown in the following screenshot:
Drawing lines of different types
In this recipe, we will be learning to display lines of different types between two points, from the mouse click location to where the mouse button is released. The user will be shown different line types to choose from, such as solid, dash line, dash-dot line, and so on. The line will be draw in the selected line type.
How to do it...
It is the QPen class that is used for defining the size or thickness of the pen used for drawing shapes. The setStyle() method of the QPen class is used in this recipe to define the style of the line. Here is the step-by-step procedure to draw lines of different styles:
- Let's create an application based on the Dialog without Buttons template.
- Add a QLabel widget to the form by dragging and dropping a Label widget on the form.
- Add a QListWidget widget by dragging and dropping a List Widget item on the form.
- Set the text property of the Label widget to Select the style from the list and then click and drag to draw a line.
- Save the application by name as demoDrawDiffLine.ui.
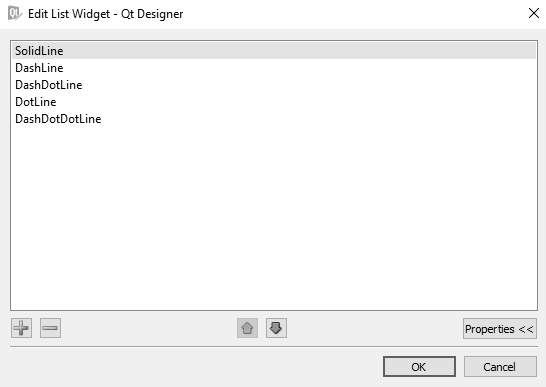
- The List Widget item will be used for showing different types of lines, so right- click on the List Widget widget and select the Edit Items option to add a few line types to the List Widget item. Click the + (plus) button at the bottom of the dialog box that opens up and add a few line types, as shown in the following screenshot:
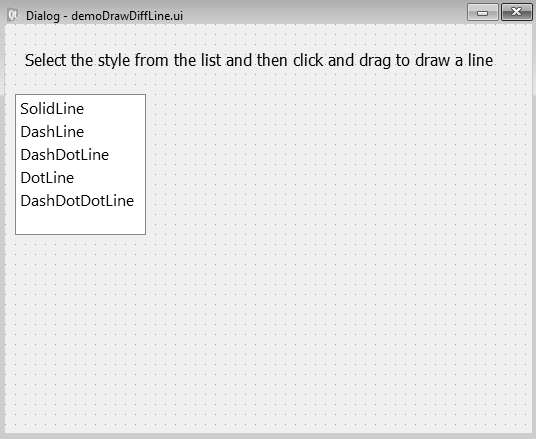
- Set the objectName property of the List Widget item to listWidgetLineType.
The form will now appear as shown in the following screenshot:
The user interface created with Qt Designer is stored in a .ui file, which is an XML file, and needs to be converted into Python code. The pyuic5 utility is used for converting the XML file into Python code. The generated Python script, demoDrawDiffLine.py, can be seen in the source code bundle of the book.
- Treat the demoDrawDiffLine.py script as a header file, and import it into the file from which you will invoke its user interface design.
- Create another Python file with the name callDrawDiffLine.pyw and import the demoDrawDiffLine.py code into it:
import sys
from PyQt5.QtWidgets import QDialog, QApplication
from PyQt5.QtGui import QPainter, QPen
from PyQt5.QtCore import Qt
from demoDrawDiffLine import *
class MyForm(QDialog):
    def __init__(self):
        super().__init__()
        self.ui = Ui_Dialog()
        self.ui.setupUi(self)
        self.lineType="SolidLine"
        self.pos1 = [0,0]
        self.pos2 = [0,0]
        self.show()
    def paintEvent(self, event):
        qp = QPainter()
        qp.begin(self)
        pen = QPen(Qt.black, 4)
        self.lineTypeFormat="Qt."+self.lineType
        if self.lineTypeFormat == "Qt.SolidLine":
            pen.setStyle(Qt.SolidLine)
        elif self.lineTypeFormat == "Qt.DashLine":
            pen.setStyle(Qt.DashLine)
        elif self.lineTypeFormat =="Qt.DashDotLine":
            pen.setStyle(Qt.DashDotLine)
        elif self.lineTypeFormat =="Qt.DotLine":
            pen.setStyle(Qt.DotLine)
        elif self.lineTypeFormat =="Qt.DashDotDotLine":
            pen.setStyle(Qt.DashDotDotLine)
        qp.setPen(pen)
        qp.drawLine(self.pos1[0], self.pos1[1],self.pos2[0], self.pos2[1])
        qp.end()
    def mousePressEvent(self, event):
        if event.buttons() & QtCore.Qt.LeftButton:
            self.pos1[0], self.pos1[1] = event.pos().x(),event.pos().y()
    def mouseReleaseEvent(self, event):
        self.lineType=self.ui.listWidgetLineType.currentItem().text()
        self.pos2[0], self.pos2[1] = event.pos().x(),event.pos().y()
        self.update()
if __name__=="__main__":
    app = QApplication(sys.argv)
    w = MyForm()
    w.show()
    sys.exit(app.exec_())
How it works...
A line has to be drawn between the mouse press and mouse release locations, so we will be making use of two methods in this application, mousePressEvent() and mouseReleaseEvent(). The mousePressEvent() method is automatically invoked when the left mouse button is clicked. Similarly, the mouseReleaseEvent() method is automatically invoked when the mouse button is released.
In these two methods, we will be saving the values of the x and y coordinates where the mouse button is clicked and released respectively. Two arrays are defined in this application, pos1 and pos2, where pos1 stores the x and y coordinates of the location where the mouse button is clicked and the pos2 array stores the x and y coordinates of the location where the mouse button is released. In the mouseReleaseEvent() method, we fetch the line type chosen by the user from the List widget and assign the chosen line type to the lineType variable. Also, the self.update() method is invoked in the mouseReleaseEvent() method to invoke the paintEvent() method. In the paintEvent() method, you define a pen of 4 pixels in width and assign it a black color.
Also, you assign a style to the pen that matches the line type chosen by the user from the List widget. Finally, the drawLine() method is invoked and the x and y coordinates stored in the pos1 and pos2 array are passed to it to draw a line between the mouse press and mouse release locations. The line will be displayed in the style that is selected from the List widget.
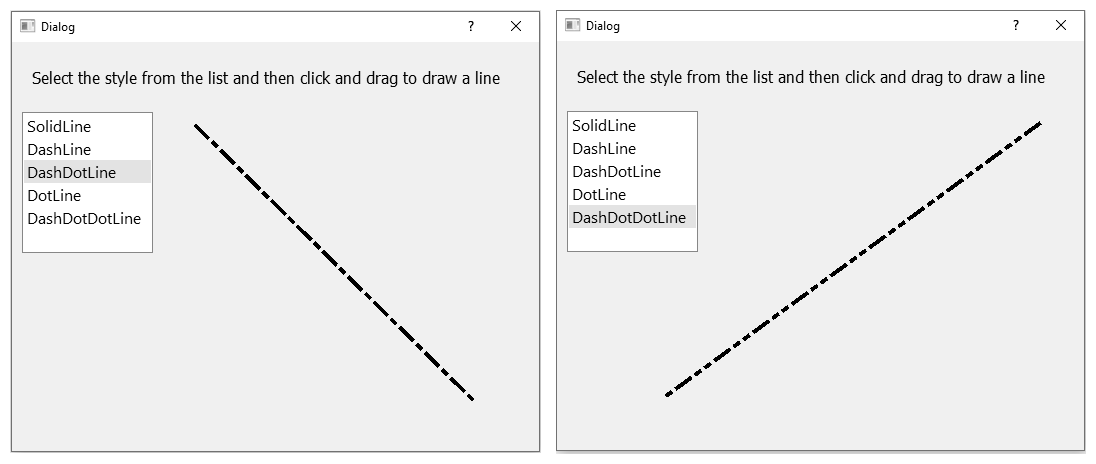
On running the application, you will get a message to select the line type from the list and click and drag the mouse button between the locations where the line is required. So, after selecting a desired line type, click the mouse button and keeping the mouse button pressed, drag it to the desired location and release the mouse button. A line will be drawn between the locations where the mouse button is clicked and where it is released in the style that is chosen from the list. The following screenshot shows the lines of different types:
Drawing a circle of a desired size
In this recipe, we will be learning to draw a circle. The user will click and drag the mouse to define the diameter of the circle, and the circle will be drawn at the diameter specified by the user.
How to do it...
A circle is nothing but an arc that is drawn from 0 to 360 degrees. The length of the arc, or you can say the diameter of the circle, is determined by the distance of mouse press event and mouse release events. A rectangle is defined internally from mouse press event until mouse release event, and the circle is drawn within that rectangle. Here are the complete steps to create this application:
- Let's create an application based on the Dialog without Buttons template.
- Add a QLabel widget to the form by dragging and dropping a Label widget on the form.
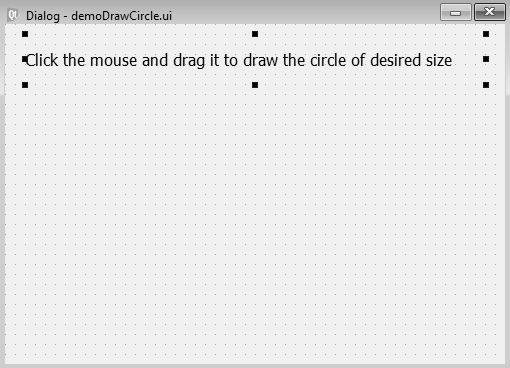
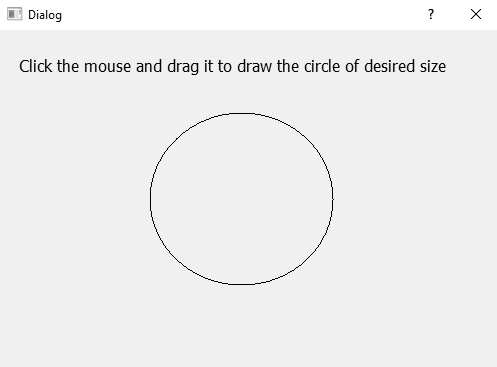
- Set the text property of the Label widget to Click the mouse and drag it to draw a circle of the desired size.
- Save the application by name as demoDrawCircle.ui. The form will now appear as shown in the following screenshot:
The user interface created with Qt Designer is stored in a .ui file and it is an XML file. The XML file is converted into Python code by applying the pyuic5 utility. You can find the generated Python code, demoDrawCircle.py, in the source code bundle of the book.
- Treat the demoDrawCircle.py script as a header file, and import it into the file from which you will invoke its user interface design.
- Create another Python file with the name callDrawCircle.pyw and import the demoDrawCircle.py code into it:
import sys
from PyQt5.QtWidgets import QDialog, QApplication
from PyQt5.QtGui import QPainter
from demoDrawCircle import *
class MyForm(QDialog):
    def __init__(self):
        super().__init__()
        self.ui = Ui_Dialog()
        self.ui.setupUi(self)
        self.pos1 = [0,0]
        self.pos2 = [0,0]
        self.show()
    def paintEvent(self, event):
        width = self.pos2[0]-self.pos1[0]
        height = self.pos2[1] - self.pos1[1]
        qp = QPainter()
        qp.begin(self)
        rect = QtCore.QRect(self.pos1[0], self.pos1[1], width,height)
        startAngle = 0
        arcLength = 360 *16
        qp.drawArc(rect, startAngle, arcLength)
        qp.end()
    def mousePressEvent(self, event):
        if event.buttons() & QtCore.Qt.LeftButton:
            self.pos1[0], self.pos1[1] = event.pos().x(),event.pos().y()
    def mouseReleaseEvent(self, event):
        self.pos2[0], self.pos2[1] = event.pos().x(),event.pos().y()
        self.update()
if __name__=="__main__":
    app = QApplication(sys.argv)
    w = MyForm()
    w.show()
    sys.exit(app.exec_())
How it works...
To draw a circle with the diameter defined between the mouse button pressed and released locations, we will be making use of two methods, mousePressEvent() and mouseReleaseEvent(). The mousePressEvent() method is automatically invoked when a mouse button is pressed and the mouseReleaseEvent() method is automatically invoked when the mouse button is released. In these two methods, we will be simply saving the values of the x and y coordinates where the mouse button is clicked and released. Two arrays, pos1 and pos2, are defined, where the pos1 array stores the x and y coordinates of the location where the mouse button is clicked and the pos2 array stores the x and y coordinates of the location where the mouse button is released. The self.update() method that is invoked in the mouseReleaseEvent() method will invoke the paintEvent() method. In the paintEvent() method, the width of the rectangle is computed by finding the difference between the x coordinates of mouse press and mouse release locations. Similarly, the height of the rectangle is computed by finding the difference between the y coordinates of mouse press and mouse release events.
The circle will be created of a size equal to the width and height of the rectangle, that is, the circle will be created within the boundaries specified by the user with the mouse.
Also, in the paintEvent() method, the drawArc() method is invoked and the rectangle, starting angle of the arc, and length of the arc are passed to it. The starting angle is specified as 0.
On running the application, you will get a message to click and drag the mouse button to define the diameter of the circle to be drawn. So, click the mouse button and keeping the mouse button pressed, drag it to the desired location and release the mouse button. A circle will be drawn between the locations where the mouse button is clicked and where it is released, as shown in the following screenshot:
Drawing a rectangle between two mouse clicks
In this recipe, we will be learning to display a rectangle between the two points where the mouse button is clicked and released on the form.
How to do it...
It is a very simple application, where the mousePressEvent() and mouseReleaseEvent() methods are used to find the x and y coordinates of the location where the mouse is pressed and released, respectively. Thereafter, the drawRect() method is invoked to draw the rectangle from the coordinates where the mouse button is clicked to the coordinates where the mouse button is released. The step-by-step procedure for creating this application is as follows:
- Let's create an application based on the Dialog without Buttons template.
- Add a QLabel widget to the form by dragging and dropping a Label widget on the form.
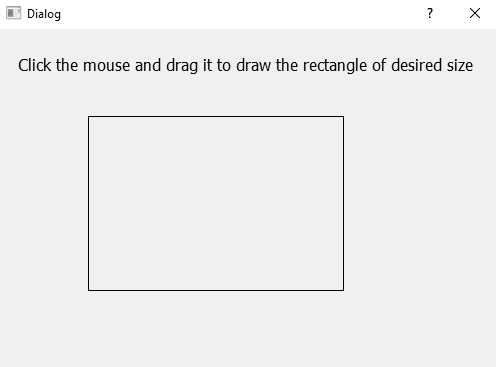
- Set the text property of the Label widget to Click the mouse and drag it to draw a rectangle of the desired size.
- Save the application by name as demoDrawRectangle.ui. The form will now appear as shown in the following screenshot:

The user interface created with Qt Designer is stored in a .ui file, which is an XML file, and needs to be converted into Python code. The pyuic5 utility is used for converting the XML file into Python code. The generated Python script, demoDrawRectangle.py, can be seen in the source code bundle of the book.
- Treat the demoDrawRectangle.py script as a header file, and import it into the file from which you will invoke its user interface design.
- Create another Python file with the name callDrawRectangle.pyw and import the demoDrawRectangle.py code into it:
import sys
from PyQt5.QtWidgets import QDialog, QApplication
from PyQt5.QtGui import QPainter
from demoDrawRectangle import *
class MyForm(QDialog):
    def __init__(self):
        super().__init__()
        self.ui = Ui_Dialog()
        self.ui.setupUi(self)
        self.pos1 = [0, 0]
        self.pos2 = [0, 0]
        self.show()
    def paintEvent(self, event):
        width = self.pos2[0]-self.pos1[0]
        height = self.pos2[1] - self.pos1[1]
        qp = QPainter()
        qp.begin(self)
        qp.drawRect(self.pos1[0], self.pos1[1], width, height)
        qp.end()
    def mousePressEvent(self, event):
        if event.buttons() & QtCore.Qt.LeftButton:
            self.pos1[0], self.pos1[1] = event.pos().x(),event.pos().y()
    def mouseReleaseEvent(self, event):
        self.pos2[0], self.pos2[1] = event.pos().x(),event.pos().y()
        self.update()
if __name__ == "__main__":
    app = QApplication(sys.argv)
    w = MyForm()
    w.show()
    sys.exit(app.exec_())
How it works...
To draw a rectangle between the mouse button pressed and released locations, we will be making use of two methods, mousePressEvent() and mouseReleaseEvent(). The mousePressEvent() method is automatically invoked when a mouse button is pressed and the mouseReleaseEvent() method is automatically invoked when the mouse button is released. In these two methods, we will be simply saving the values of the x and y coordinates where the mouse button is clicked and released respectively. Two arrays, pos1 and pos2, are defined, where the pos1 array stores the x and y coordinates of the location where the mouse button is clicked and the pos2 array stores the x and y coordinates of the location where the mouse button is released. The self.update() method that is invoked in the mouseReleaseEvent() method will invoke the paintEvent() method. In the paintEvent() method, the width of the rectangle is computed by finding the difference between the x coordinates of mouse press and mouse release locations. Similarly, the height of the rectangle is computed by finding the difference between the y coordinates of mouse press and mouse release events.
Also, in the paintEvent() method, the drawRect() method is invoked and the x and y coordinates stored in the pos1 array are passed to it. Also, the width and height of the rectangle are passed to the drawRect() method to draw the rectangle between the mouse press and mouse release locations.
On running the application, you will get a message to click and drag the mouse button between the locations where the rectangle is required. So, click the mouse button and keeping the mouse button pressed, drag it to the desired location and release the mouse button.
A rectangle will be drawn between the locations where the mouse button is clicked and where it is released, as shown in the following screenshot:
Drawing text in a desired font and size
In this recipe, we will learn to draw text in a specific font and at a specific font size. Four widgets will be required in this recipe such as Text Edit, List Widget, Combo Box, and Push Button. The Text Edit widget will be used to enter the text that the user wants to display in the desired font and size. The List Widget box will display different font names that the user can select from. The Combo Box widget will display font sizes that the user can select to define the size of the text. The Push Button widget will initiate the action, that is, the text entered in the Text Edit widget will be displayed in the chosen font and size on clicking the push button.
How to do it...
The QPainter class is the focus of this recipe. The setFont() and drawText() methods of the QPainter class will be used in this recipe. The setFont() method will be invoked to set the font style and font size chosen by the user and the drawText() method will draw the text written by the user in the Text Edit widget in the specified font style and size. Here is the step-by-step procedure to learn how these methods are used:
- Let's create an application based on the Dialog without Buttons template.
- Add the QLabel, QTextEdit, QListWidget, QComboBox, and QPushButton widgets to the form by dragging and dropping a Label widget, a Text Edit widget, a List Widget box, a Combo Box widget, and a Push Button widget on the form.
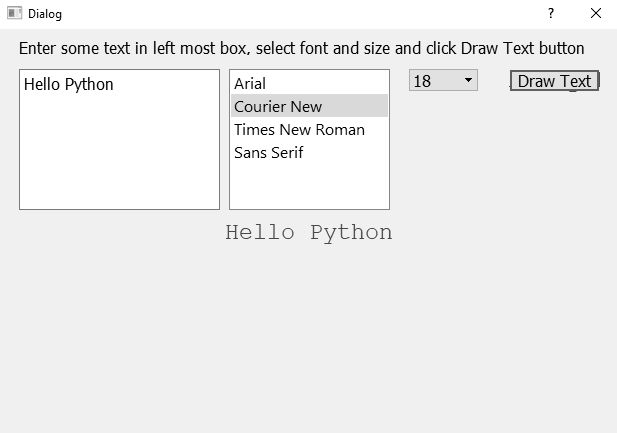
- Set the text property of the Label widget to Enter some text in leftmost box, select font and size, and click the Draw Text button.
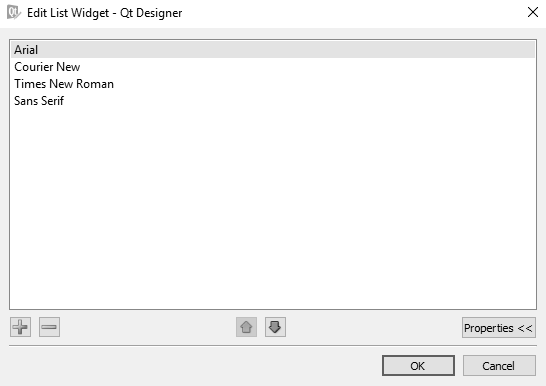
- The List Widget box will be used for showing different fonts, so right-click on the List Widget box and select the Edit Items option to add a few font names to the List Widget box. Click the + (plus) button at the bottom of the dialog box that opens up and add a few font names, as shown in the following screenshot:
- The Combo Box widget will be used for showing different font sizes, so we need to add certain font sizes to the Combo Box widget. Right-click on the Combo Box widget and select the Edit Items option.
- Click the + (plus) button at the bottom of the dialog box that opens up and add a couple of font sizes, as shown in the following screenshot:

- Set the text property of the Push Button widget to Draw Text.
- Set the objectName property of the List Widget box to listWidgetFont.
- Set the objectName property of the Combo Box widget to comboBoxFontSize.
- Set the objectName property of the Push Button widget to pushButtonDrawText.
- Save the application by name as demoDrawText.ui.
The form will now appear as shown in this screenshot:

The user interface created with Qt Designer is stored in a .ui file and it is an XML file. The XML file is converted into Python code by applying the pyuic5 utility. You can find the generated Python code, demoDrawText.py, in the source code bundle of the book.
- Treat the demoDrawText.py script as a header file, and import it into the file from which you will invoke its user interface design.
- Create another Python file with the name callDrawText.pyw and import the demoDrawText.py code into it:
import sys
from PyQt5.QtWidgets import QDialog, QApplication
from PyQt5.QtGui import QPainter, QColor, QFont
from PyQt5.QtCore import Qt
from demoDrawText import *
class MyForm(QDialog):
    def __init__(self):
        super().__init__()
        self.ui = Ui_Dialog()
        self.ui.setupUi(self)
        self.ui.pushButtonDrawText.clicked.connect(self.dispText)
        self.textToDraw=""
        self.fontName="Courier New"
        self.fontSize=5
        self.show()
    def paintEvent(self, event):
        qp = QPainter()
        qp.begin(self)
        qp.setPen(QColor(168, 34, 3))
        qp.setFont(QFont(self.fontName, self.fontSize))
        qp.drawText(event.rect(), Qt.AlignCenter,self.textToDraw)
        qp.end()
    def dispText(self):
        self.fontName=self.ui.listWidgetFont.currentItem().text()
        self.fontSize=int(self.ui.comboBoxFontSize.itemText(self.ui.comboBoxFontSize.currentIndex()))
        self.textToDraw=self.ui.textEdit.toPlainText()
        self.update()
if __name__=="__main__":
    app = QApplication(sys.argv)
    w = MyForm()
    w.show()
    sys.exit(app.exec_())
How it works...
The click() event of the Push Button widget is connected to the dispText() method, that is, whenever the push button is clicked, the dispText() method will be invoked.
In the dispText() method, the font name selected from the List Widget box is accessed and assigned to the fontName variable. Also, the font size selected from the combo box is accessed and assigned to the fontSize variable. Besides this, the text written in the Text Edit widget is fetched and assigned to the textToDraw variable. Finally, the self.update() method is invoked; it will invoke the paintEvent() method.
In the paintEvent() method, the drawText() method is called and will draw the text written in the Text Edit widget in the font style that is assigned to the fontName variable, and in the font size specified in the fontSize variable. On running the application, you will find a Text Edit widget on the extreme left, font names displayed in the List Widget box, and font sizes displayed via the Combo box widget. You need to enter some text in the Text Edit widget, select a font style from the List Widget box and font size from the Combo Box widget, and click on the Draw Text button. On clicking the Draw Text button, the text written in the Text Edit widget will be displayed in the selected font and selected font size, as shown in the following screenshot:

Creating a toolbar that shows different graphics tools
In this recipe, we will learn to create a toolbar that shows three toolbar buttons. These three toolbar buttons show the icons for the line, circle, and rectangle. When the user clicks the line toolbar button from the toolbar, he/she can click and drag the mouse on the form to draw a line between the two mouse locations. Similarly, by clicking on the circle toolbar button, the user can draw a circle on the form by clicking and dragging the mouse.
How to do it…
The focus of this recipe is to help you understand how frequently used commands in an application can be provided to the user via a toolbar, making them easy to access and use. You will learn to create toolbar buttons, define their shortcuts, and their icons too. To define the icons for the toolbar buttons, you will learn to create and use the resource file. The creation and execution of each toolbar button is explained very clearly step by step:
- Let’s create a new application to understand the steps involved in creating a toolbar.
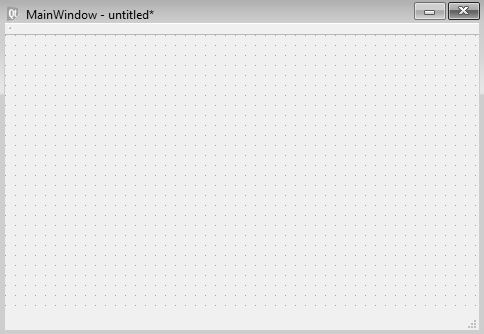
- Launch Qt Designer and create a main window-based application. You get a new application with the default menu bar.
- You can remove the menu bar by right-clicking on it and selecting the Remove Menu Bar option from the shortcut menu that pops up.
- To add a toolbar, right-click on the Main Window template and select Add Tool Bar from the context menu. A blank toolbar will be added below the menu bar, as shown in the following screenshot:
We want to create a toolbar with three toolbar buttons, line, circle, and rectangle. Since the three toolbar buttons will represent three icon images, we assume we have icon files, that is, files with an extension .ico for the line, circle, and rectangle.
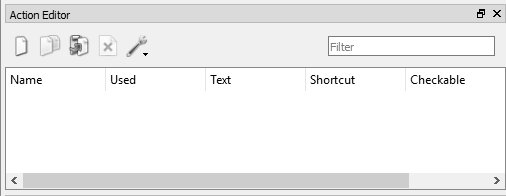
- To add tools to the toolbar, create an action in the Action Editor box; each toolbar button in the toolbar is represented by an action. The Action Editor box is usually found below the Property Editor window.
- If the Action Editor window is not visible, select Action Editor from the View menu. The Action Editor window appears as shown here:
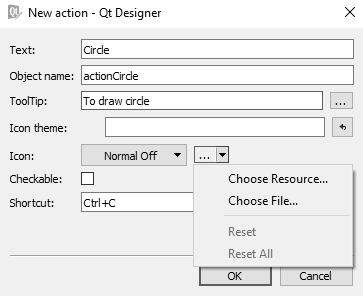
- In the Action Editor window, select the New button to create an action for the first toolbar button. You get the dialog to enter detailed information for the new action.
- In the Text box, specify the name of the action, Circle.
- In the Object name box, the name of the action object automatically appears, prefixed with the text action.
- In the ToolTip box, enter any descriptive text.
- In the Shortcut box, press Ctrl + C character to assign Ctrl + C as the shortcut key for drawing a circle.
- The Icon drop-down list shows two options, Choose Resource... and Choose File.
- You can assign an icon image to the action either by clicking the Choose File... option or from the resource file:
You can select several icons in a resource file and that resource file can then be used in different applications.
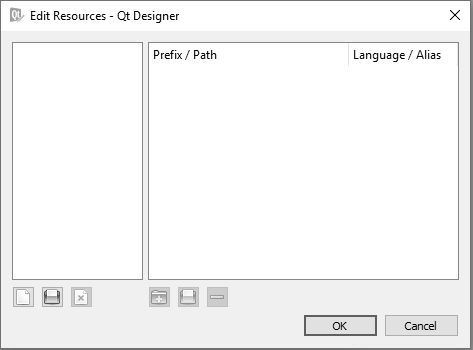
- Select the Choose Resource... option. You get the Select Resource dialog, as shown in the following screenshot:
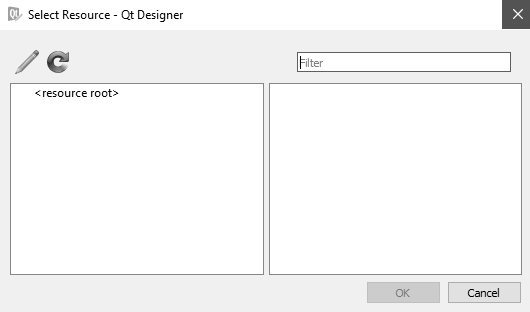
Since no resource has yet been created, the dialog box is empty. You see two icons at the top. The first icon represents Edit Resources and the second icon represents Reload. On clicking the Edit Resources icon, you get the dialog shown here:
Now let's see how we can create a resource file by performing the following steps:
- The first step is to create a resource file or load an existing resource file. The first three icons at the bottom represent New Resource File, Edit Resource File, and Remove.
- Click on New Resource File icon. You will be prompted to specify the name of the resource file.
- Let's name the new resource file iconresource. The file will be saved with the extension .qrc.
- The next step is to add a prefix to the resource file. The three icons below the Prefix / Path pane are Add Prefix, Add Files, and Remove.
- Click on the Add Prefix option, and you will be prompted to enter the prefix name.
- Enter the prefix as Graphics. After adding the prefix, we are ready to add our three icons, circle, rectangle, and line, to the resource file. Recall that we have three icon files with the extension .ico.
- Click the Add Files option to add icons. On clicking the Add Files option, you will be asked to browse to the drive/directory and select the icon files.
- Select the three icon files one by one. After adding the three icons, the Edit Resources dialog appears as shown here:
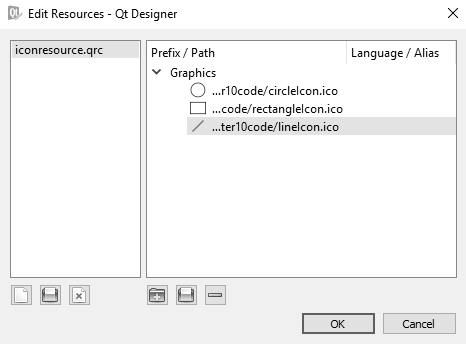
- On clicking the OK button, the resource file will appear, showing the three icons to choose from.
- Since we want to assign an icon for the circle action, click on the circle icon, followed by clicking the OK button:
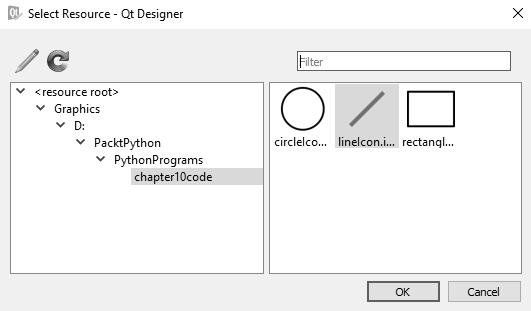
The selected circle icon will be assigned to actionCircle.
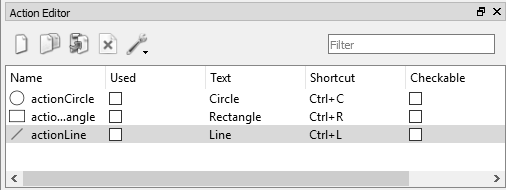
- Similarly, create two more actions, actionRectangle and actionLine, for the rectangle and line toolbar buttons. After adding the three actions, the Action Editor window will appear as shown here:
- To display the toolbar buttons in the toolbar, click one action from the Action Editor window and, keeping it pressed, drag it to the toolbar.
- Save the application with the name demoToolBars.ui.
After dragging the three actions to the toolbar, the toolbar will appear as shown here:
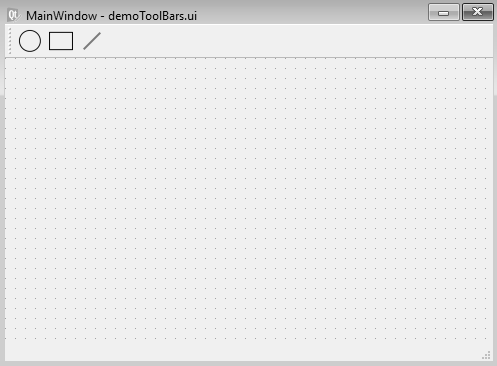
The pyuic5 command line utility will convert the .ui (XML) file into Python code, and the generated code will be named demoToolBars.py. You can find the demoToolBars.py script in the source code bundle of this book. The iconresource.qrc file that we created must be converted into Python format before we move further. The following command line will convert the resource file into a Python script:
pyrcc5 iconresource.qrc -o iconresource_rc.py
- Create a Python script named callToolBars.pyw that imports the code, demoToolBar.py, to invoke the toolbar and to draw the graphic whose toolbar button is selected from the toolbar. The script file will appear as follows:
# -*- coding: utf-8 -*-

# Form implementation generated from reading ui file 'C:\Users\neo21\Documents\book\qt5\Qt5-Python-GUI-Programming-Cookbook\Qt5-Python-GUI-Programming-Cookbook-master\Qt5-Python-GUI-Programming-Cookbook-master\Chapter10\demoToolBars.ui'
#
# Created by: PyQt5 UI code generator 5.15.4
#
# WARNING: Any manual changes made to this file will be lost when pyuic5 is
# run again.  Do not edit this file unless you know what you are doing.


from PyQt5 import QtCore, QtGui, QtWidgets


class Ui_MainWindow(object):
    def setupUi(self, MainWindow):
        MainWindow.setObjectName("MainWindow")
        MainWindow.resize(800, 600)
        self.centralwidget = QtWidgets.QWidget(MainWindow)
        self.centralwidget.setObjectName("centralwidget")
        MainWindow.setCentralWidget(self.centralwidget)
        self.statusbar = QtWidgets.QStatusBar(MainWindow)
        self.statusbar.setObjectName("statusbar")
        MainWindow.setStatusBar(self.statusbar)
        self.toolBar = QtWidgets.QToolBar(MainWindow)
        self.toolBar.setObjectName("toolBar")
        MainWindow.addToolBar(QtCore.Qt.TopToolBarArea, self.toolBar)
        self.actionCircle = QtWidgets.QAction(MainWindow)
        icon = QtGui.QIcon()
        icon.addPixmap(QtGui.QPixmap(":/Graphics/Circle.ico"), QtGui.QIcon.Normal, QtGui.QIcon.Off)
        self.actionCircle.setIcon(icon)
        self.actionCircle.setObjectName("actionCircle")
        self.actionRectangle = QtWidgets.QAction(MainWindow)
        icon1 = QtGui.QIcon()
        icon1.addPixmap(QtGui.QPixmap(":/Graphics/Rectangle.ico"), QtGui.QIcon.Normal, QtGui.QIcon.Off)
        self.actionRectangle.setIcon(icon1)
        self.actionRectangle.setObjectName("actionRectangle")
        self.actionLine = QtWidgets.QAction(MainWindow)
        icon2 = QtGui.QIcon()
        icon2.addPixmap(QtGui.QPixmap(":/Graphics/Line.ico"), QtGui.QIcon.Normal, QtGui.QIcon.Off)
        self.actionLine.setIcon(icon2)
        self.actionLine.setObjectName("actionLine")
        self.toolBar.addAction(self.actionCircle)
        self.toolBar.addAction(self.actionRectangle)
        self.toolBar.addAction(self.actionLine)

        self.retranslateUi(MainWindow)
        QtCore.QMetaObject.connectSlotsByName(MainWindow)

    def retranslateUi(self, MainWindow):
        _translate = QtCore.QCoreApplication.translate
        MainWindow.setWindowTitle(_translate("MainWindow", "MainWindow"))
        self.toolBar.setWindowTitle(_translate("MainWindow", "toolBar"))
        self.actionCircle.setText(_translate("MainWindow", "Circle"))
        self.actionCircle.setShortcut(_translate("MainWindow", "Ctrl+Shift+C"))
        self.actionRectangle.setText(_translate("MainWindow", "Rectangle"))
        self.actionRectangle.setShortcut(_translate("MainWindow", "Ctrl+Shift+R"))
        self.actionLine.setText(_translate("MainWindow", "Line"))
        self.actionLine.setShortcut(_translate("MainWindow", "Ctrl+Shift+L"))
import iconresource_rc


if __name__ == "__main__":
    import sys
    app = QtWidgets.QApplication(sys.argv)
    MainWindow = QtWidgets.QMainWindow()
    ui = Ui_MainWindow()
    ui.setupUi(MainWindow)
    MainWindow.show()
    sys.exit(app.exec_())
How it works...
The triggered() signal of the action of each toolbar button is connected to the respective method. The triggered() signal of the actionCircle toolbar button is connected to the drawCircle() method, so whenever the circle toolbar button is selected from the toolbar, the drawCircle() method will be invoked. Similarly, the triggered() signal of actionRectangle and actionLine are connected to the drawRectangle() and drawLine() methods, respectively. In the drawCircle() method, a variable toDraw is assigned a string, circle. The toDraw variable will be used to determine the graphics to be drawn in the paintEvent() method. The toDraw variable can be assigned any of the three strings, line, circle, or rectangle. A conditional branching is applied on the value in the toDraw variable and accordingly, methods to draw a line, rectangle, or circle will be invoked.
How big a line, circle, or rectangle will be drawn is determined by the mouse clicks; the user needs to click the mouse on the form and drag the mouse and release it at the location up to which he/she wants to draw the line, circle, or rectangle. In other words, the length of the line, width and height of the rectangle, and diameter of the circle will be determined by the mouse.
Two arrays, pos1 and pos2, are used to store the x and y coordinates of the location where the mouse is clicked and the location where the mouse is released, respectively. The x and y coordinate values are assigned to the pos1 and pos2 array via two methods, mousePressEvent() and mouseReleaseEvent(). The mousePressEvent() method is automatically invoked when the mouse button is clicked and the mouseReleaseEvent() method is automatically invoked when the mouse button is released.
In the mouseReleaseEvent() method, after assigning the x and y coordinate values of the location where the mouse button is released, the self.update() method is invoked to invoke the paintEvent() method. In the paintEvent() method, branching takes place on the basis of the string assigned to the toDraw variable. If the toDraw variable is assigned the string line (by the drawLine() method), the drawLine() method will be invoked of QPainter class to draw the line between the two mouse locations. Similarly, if the toDraw variable is assigned the string circle (by the drawCircle() method), the drawArc() method will be invoked of the QPainter class to draw a circle with a diameter supplied by mouse locations. If the toDraw variable is assigned the string rectangle by the drawRectangle() method, then the drawRect() method will be invoked of the QPainter class to draw a rectangle of the width and height supplied by the mouse locations.
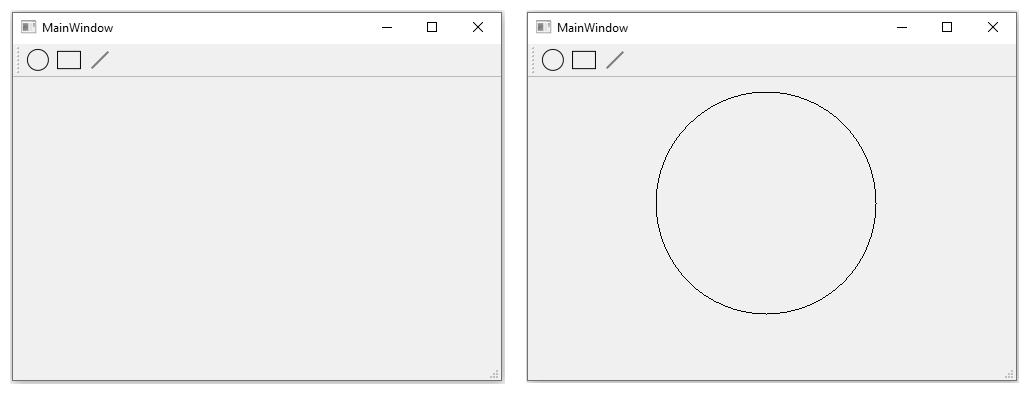
On running the application, you will find a toolbar with three toolbar buttons, circle, rectangle, and line, as shown in the following screenshot (left). Click on the circle toolbar button, then click the mouse button on the form, and, keeping the mouse button pressed, drag it to define the diameter of the circle and release the mouse button. A circle will be drawn from the location where the mouse button is clicked up to the location where the mouse button is released (right):
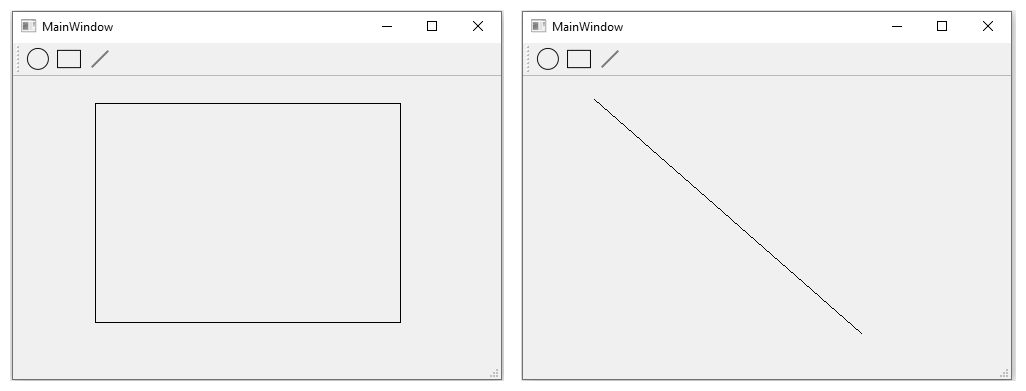
To draw a rectangle, click on the rectangle tool, click the mouse button at a location on the form, and, keeping the mouse button pressed, drag it to define the height and width of the rectangle. On releasing the mouse button, a rectangle will be drawn between the mouse pressed and mouse released locations (left). Similarly, click the line toolbar button and click the mouse button on the form. Keeping the mouse button pressed, drag it up to the location where you want the line to be drawn. On releasing the mouse button, a line will be drawn between the locations where the mouse button is clicked and released (right):
Plotting a line using Matplotlib
In this recipe, we will learn to plot a line using Matplotlib that passes through specific x and y coordinates.
Matplotlib is a Python 2D plotting library that makes the complicated task of plotting lines, histograms, bar charts, and so on quite easy. This library not only plots, but also provides an API that enables the embedding of plots in applications too.
Getting ready
You can install Matplotlib by using the following statement:
pip install matplotlib
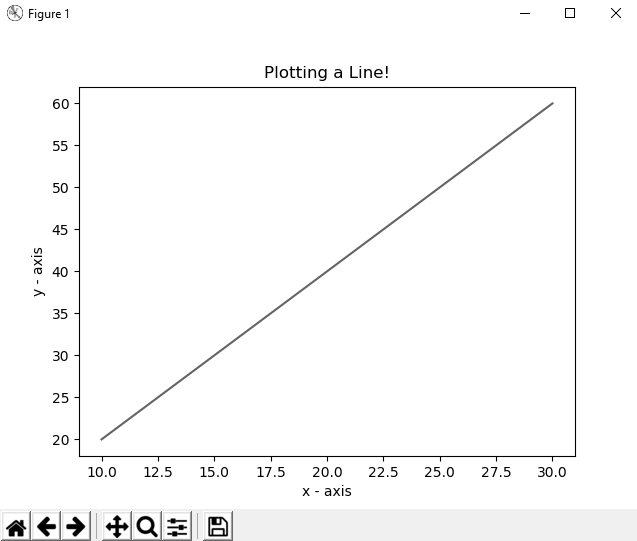
Let's assume that we want to plot a line that uses the following sets of x and y coordinates:
x=10, y=20 x=20, y=40 x=30, y=60
On the x axis, the value of x begins from 0 and increases towards the right and on the y axis, the value of y is 0 at the bottom and increases as we move up. Because the last pair of coordinates is 30, 60, the graph will have the maximum x value of 30 and the maximum y value of 60.
The following methods of matplotlib.pyplot will be used in this recipe:
- title(): This method is used to set the title of the graph
- xlabel(): This method is to display the specific text along the x axis
- ylabel(): This method is to display the specific text along the y axis
- plot(): This method is used for plotting at the specified x and y coordinates
How to do it...
Create a Python script with the name demoPlotLine.py and write the following code in it:
import matplotlib.pyplot as graph
graph.title('Plotting a Line!')
graph.xlabel('x - axis')
graph.ylabel('y - axis')
x = [10,20,30]
y = [20,40,60]
graph.plot(x, y)
graph.show()
How it works...
You import matplotlib.pyplot in the script and name it graph. Using the title() method, you set the title of the graph. Thereafter, the xlabel() and ylabel() methods are invoked to define the text for the x axis and y axis, respectively. Because we want to plot a line using three sets of x and y coordinates, two arrays are defined by name, x and y. The values of the x and y coordinates that we want to plot are defined in the two arrays, x and y, respectively. The plot() method is invoked and the two x and y arrays are passed to it to plot the line using the three x and y coordinate values defined in the two arrays. The show method is invoked to display the plotting.
On running the application, you find that a line is plotted that passes through the specified x and y coordinates. Also, the graph will show the specified title, Plotting a Line !. Besides this, you can see the designated text being displayed along the x axis and y axis as shown in the following screenshot:
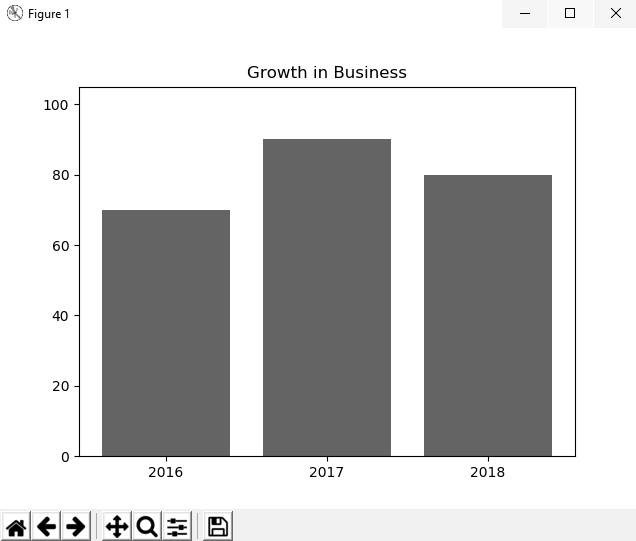
Plotting a bar using Matplotlib
In this recipe, we will learn to plot a bar using Matplotlib that compares the growth of a business over past three years. You will supply the profit percentage in 2016, 2017, and 2018 and the application will show a bar representing the profit percentage in the past three years.
Getting ready
Let's assume that the profit percentage of the organization over the last three years is as follows:
- 2016: Profit was 70%
- 2017: Profit was 90%
- 2018: Profit is 80%
You want to display bars that represent profit percentages and along the x axis, and you want the years to be displayed: 2016, 2017, and 2018. Along the y axis, you want to display the bar that represent the profit percentage. The value of y on the y axis will begin from 0 at the bottom and increases while moving toward the top, with the maximum value, 100, at the top.
The following methods of matplotlib.pyplot will be used in this recipe:
- title(): This method is used to set the title of the graph
- bar(): To plot the bar from the two supplied arrays; one array will represent data for the x axis, and the second array will represent data for the y axis
- plot(): This method is used for plotting at the specified x and y coordinates
How to do it...
Create a Python script with the name demoPlotBars.py and write the following code in it:
import matplotlib.pyplot as graph
years = ['2016', '2017', '2018']
profit = [70, 90, 80]
graph.bar(years, profit)
graph.title('Growth in Business')
graph.plot(100)
graph.show()
How it works...
You import matplotlib.pyplot in the script and name it graph. You define two arrays, years and profit, where the years array will contain the data for 2016, 2017, and 2018 to represent the years whose profits we want to compare. Similarly, the profit array will contain the values that represent the profit percentages for the last three years. Thereafter, the bar() method is invoked and the two arrays, years and profit, are passed to it to display the bar comparing profits in the last three years. The title() method is invoked to display the title, Growth in Business. The plot() method is invoked to indicate the maximum y value along the y axis. Finally, the show() method is invoked to display the bar.
On running the application, you find that a bar is plotted that displays the profits of the organization in the past three years. The x axis shows the years and the y axis shows the profit percentage. Also, the graph will show the specified title, Growth in Business as shown in the following screenshot:
'Qt5 Python GUI Programming Cookbook' 카테고리의 다른 글
| Using Google Maps (0) | 2023.02.28 |
|---|---|
| Implementing Animation (0) | 2023.02.28 |
| Database Handling (0) | 2023.02.28 |
| Doing Asynchronous Programming in Python (1) | 2023.02.28 |
| Networking and Managing Large Documents (1) | 2023.02.28 |


댓글