# 기본적인 import들
# 이후 그래프 그리는 코드에는 중복으로 적지 않음.
# 다른 곳으로 그래프 그리는 코드를 복사-붙이기 할 때는
# 이 import 코드와 함께 복사-붙이기 해야함
import numpy as np
import matplotlib.pyplot as plt
import matplotlib as mpl
from mpl_toolkits import mplot3d
import matplotlib.font_manager as mfm

# numpy 출력 형식 지정
np.set_printoptions(precision=4, linewidth=150)

# matplotlib 스타일 지정
mpl.style.use('bmh')
mpl.style.use('seaborn-v0_8-whitegrid')
style = plt.style.library['bmh']
# 스타일 컬러를 쉽게 쓸 수 있도록 리스트 저장
style_colors = [ c['color'] for c in style['axes.prop_cycle'] ]

# 그림을 로컬 폴더에 저장하고 싶으면 True로 수정
file_print = False
그림 5-2
fig = plt.figure(figsize=(7, 7))
ax = fig.add_subplot(1, 1, 1)

ax.xaxis.set_tick_params(labelsize=18)
ax.yaxis.set_tick_params(labelsize=18)
ax.set_xlabel(r'$x$', fontsize=25)
ax.set_ylabel(r'$y$', fontsize=25)
ax.grid(False)

x = np.linspace(0.01, 0.3, 100)

h = 0.01

g  = lambda x : x**2 + 3*x
dg = lambda x : (g(x+h)-g(x)) / h

f  = lambda x : np.sqrt(x)
df = lambda x : (f(x+h)-f(x)) / h

dfg = lambda x : (2*x+3) / (2*np.sqrt(x**2+3*x))

plt.plot( x, f(g(x)), 'k', label=r"$f(g(x))$")
plt.plot( x, dfg(x),  'k', label=r"$f'(g(x))$", lw=7)
plt.plot( x, df(g(x))*dg(x), c='white' )

plt.plot( x, dfg(x)-df(g(x))*dg(x), '--', c='k', label="error")

plt.legend(loc="right", fontsize=18)

if file_print == True :
    fig.savefig("imgs/chap5/fig5-2.png", dpi=300, bbox_inches='tight')
    fig.savefig("imgs/chap5/fig5-2.pdf", format='pdf', bbox_inches='tight')

plt.show()
그림 5-3
fig = plt.figure(figsize=(7, 7))
ax = fig.add_subplot(1, 1, 1)

ax.xaxis.set_tick_params(labelsize=18)
ax.yaxis.set_tick_params(labelsize=18)
ax.set_xlabel(r'$x$', fontsize=25)
ax.set_ylabel(r'$y$', fontsize=25)
ax.grid(False)

x = np.linspace(0.01, 0.3, 100)

g  = lambda x : x**2 + 3*x
dg = lambda x : 2*x + 3

f  = lambda x : np.sqrt(x)
df = lambda x : 1/(2*np.sqrt(x))

dfg = lambda x : (2*x+3) / (2*np.sqrt(x**2+3*x))

plt.plot( x, f(g(x)), 'k', label=r"$f(g(x))$")
plt.plot( x, dfg(x),  'k', label=r"$f'(g(x))$", lw=7)
plt.plot( x, df(g(x))*dg(x), c='white' )

plt.plot( x, dfg(x)-df(g(x))*dg(x), '--', c='k', label="error")

plt.legend(loc="right", fontsize=18)

if file_print == True :
    fig.savefig("imgs/chap5/fig5-3.png", dpi=300, bbox_inches='tight')
    fig.savefig("imgs/chap5/fig5-3.pdf", format='pdf', bbox_inches='tight')

plt.show()
그림 5-4
fig = plt.figure(figsize=(7, 7))
ax = fig.add_subplot(1, 1, 1)

ax.set_xticklabels( () )
ax.set_yticklabels( () )
ax.grid(False)

x = np.linspace(0.995, 1.015, 50)

X, Y = np.meshgrid(x, x)
f = lambda x, y : 2*x**2 + 1.5*y**2

plt.axis("equal")
ax.plot(1, 1, 'o', c='k', markersize=10)
ax.contour(X, Y, f(X,Y))

h=0.01
theta = np.pi/6
x1, y1 = 1 + h*np.cos(theta), 1 +h*np.sin(theta)
ax.plot(x1, y1, 'D', c='k', markersize=10)

theta = np.pi/4
x2, y2 = 1 + h*np.cos(theta), 1 + h*np.sin(theta)
ax.plot(x2, y2, '^', c='k', markersize=10)

theta = np.pi/3
x3, y3 = 1 + h*np.cos(theta), 1 + h*np.sin(theta)
ax.plot(x3, y3, 's', c='k', markersize=10)

if file_print == True :
    fig.savefig("imgs/chap5/fig5-4.png", dpi=300, bbox_inches='tight')
    fig.savefig("imgs/chap5/fig5-4.pdf", format='pdf', bbox_inches='tight')


plt.show()

print("x1: {:.6f}, y1: {:.6f}".format(x1, y1))
print("x2: {:.6f}, y2: {:.6f}".format(x2, y2))
print("x3: {:.6f}, y3: {:.6f}".format(x3, y3))

print( "(f(x1, y1)-f(1, 1))/h={:.6f}".format((f(x1, y1)-f(1, 1))/h) )
print( "(f(x2, y2)-f(1, 1))/h={:.6f}".format((f(x2, y2)-f(1, 1))/h) )
print( "(f(x3, y3)-f(1, 1))/h={:.6f}".format((f(x3, y3)-f(1, 1))/h) )
x1: 1.008660, y1: 1.005000
x2: 1.007071, y2: 1.007071
x3: 1.005000, y3: 1.008660
(f(x1, y1)-f(1, 1))/h=4.982852
(f(x2, y2)-f(1, 1))/h=4.967247
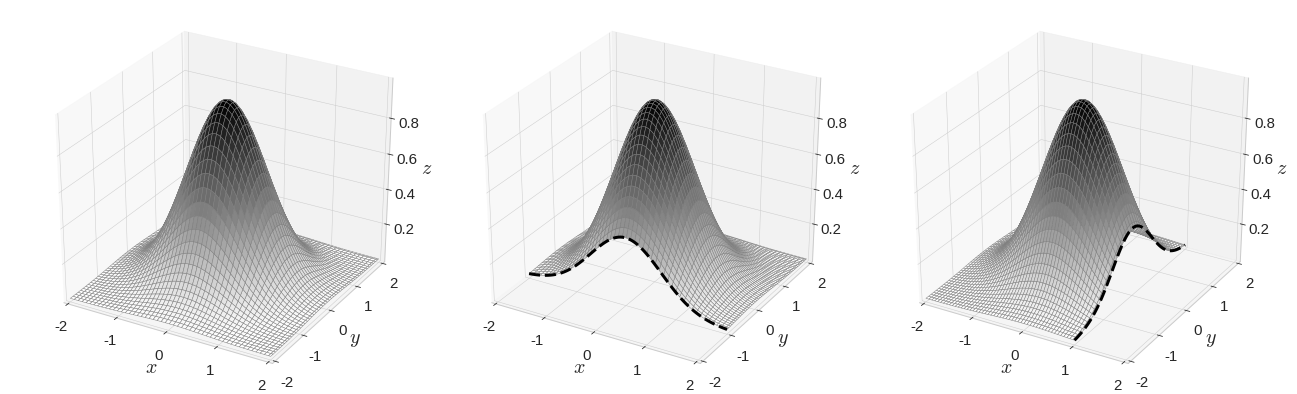
(f(x3, y3)-f(1, 1))/h=4.614326그림 5-5
fig = plt.figure(figsize=(23,7))

f = lambda x, y :np.exp(-(x**2 + y**2))

#####################################################################
x = np.linspace(-2,2,100)
y = np.linspace(-2,2,100)
X, Y = np.meshgrid(x, y)
Z = f(X,Y)

ax1 = fig.add_subplot(131, projection='3d')
ax1.plot_surface(X, Y, Z, cmap=plt.cm.binary, edgecolor="gray", alpha=1)
# ax.view_init(50, 50)
ax1.xaxis.set_tick_params(labelsize=15)
ax1.yaxis.set_tick_params(labelsize=15)
ax1.zaxis.set_tick_params(labelsize=15)
ax1.set_xlabel('$x$', fontsize=20)
ax1.set_ylabel('$y$', fontsize=20)
ax1.set_zlabel('$z$', fontsize=20)
ax1.set_xlim([-2, 2])
ax1.set_ylim([-2, 2])
ax1.set_xticks( [-2, -1, 0, 1, 2] )
ax1.set_xticklabels([-2, -1, 0, 1, 2] , fontsize=15 )
ax1.set_yticks( [-2, -1, 0, 1, 2] )
ax1.set_yticklabels([-2, -1, 0, 1, 2] , fontsize=15 )

#####################################################################
x = np.linspace(-2,2,100)
y = np.linspace(-1,2,100)
X, Y = np.meshgrid(x, y)
Z = f(X,Y)

ax2 = fig.add_subplot(132, projection='3d')
ax2.plot_surface(X, Y, Z, cmap=plt.cm.binary, edgecolor="gray", alpha=1)
ax2.xaxis.set_tick_params(labelsize=15)
ax2.yaxis.set_tick_params(labelsize=15)
ax2.zaxis.set_tick_params(labelsize=15)
ax2.set_xlabel('$x$', fontsize=20)
ax2.set_ylabel('$y$', fontsize=20)
ax2.set_zlabel('$z$', fontsize=20)
ax2.set_xlim([-2, 2])
ax2.set_ylim([-2, 2])
ax2.set_xticks( [-2, -1, 0, 1, 2] )
ax2.set_xticklabels([-2, -1, 0, 1, 2] , fontsize=15 )
ax2.set_yticks( [-2, -1, 0, 1, 2] )
ax2.set_yticklabels([-2, -1, 0, 1, 2] , fontsize=15 )

Zx = f(x, -1)
ax2.plot3D(x, [-1.]*x.shape[0], Zx, '--', lw=3, c='k')


#####################################################################
x = np.linspace(-2,1,100)
y = np.linspace(-2,2,100)
X, Y = np.meshgrid(x, y)
Z = f(X,Y)

ax3 = fig.add_subplot(133, projection='3d')
ax3.plot_surface(X, Y, Z, cmap=plt.cm.binary, edgecolor="gray", alpha=1)
ax3.xaxis.set_tick_params(labelsize=15)
ax3.yaxis.set_tick_params(labelsize=15)
ax3.zaxis.set_tick_params(labelsize=15)
ax3.set_xlabel('$x$', fontsize=20)
ax3.set_ylabel('$y$', fontsize=20)
ax3.set_zlabel('$z$', fontsize=20)
ax3.set_xlim([-2, 2])
ax3.set_ylim([-2, 2])
ax3.set_xticks( [-2, -1, 0, 1, 2] )
ax3.set_xticklabels([-2, -1, 0, 1, 2] , fontsize=15 )
ax3.set_yticks( [-2, -1, 0, 1, 2] )
ax3.set_yticklabels([-2, -1, 0, 1, 2] , fontsize=15 )

Zy = f(1, y)
ax3.plot3D([1.]*x.shape[0], y, Zy, '--', lw=3, c='k')

plt.subplots_adjust(wspace=0.0)

if file_print == True :
    fig.savefig("imgs/chap5/fig5-5.png", dpi=300, bbox_inches='tight')
    fig.savefig("imgs/chap5/fig5-5.pdf", format='pdf', bbox_inches='tight')

plt.show()


댓글